Evaluation of an Employee Survey
Our Services in the Evaluation Phase
From data analysis to the understandable preparation of the results: We support you in the evaluation of your employee survey. This gives you a clear overview of the core topics and enables you to make well-founded decisions for the future.

Input, Control and Management of the Collected Data
Access to the employee survey will be closed after the end of the survey period. Only paper questionnaires sent by the client (if available) will be taken into account.
The answers received online or (in rare cases) recorded/scanned from paper questionnaires are processed, checked, secured and subject to ongoing quality management.
Analyzing existing survey data
If you already have raw data from an employee survey – e.g., from your own internal survey – and are looking for a service provider for analysis and reporting, we would be happy to assist you.

General Information on the Overall Result for the Workforce
We recommend providing general feedback/communication to the workforce relatively quickly after the survey. Expressing thanks for the (hopefully) active participation, initial positive impressions of the overall results, etc. can be useful and helpful here. Our Cubia project manager will be happy to support you with appropriate project-specific recommendations.
Further information is available on our specialist portal: www.mitarbeiterbefragungen.comOpen in new tab

Employee Survey Results Reports
Reports for all Organizational Units and Areas
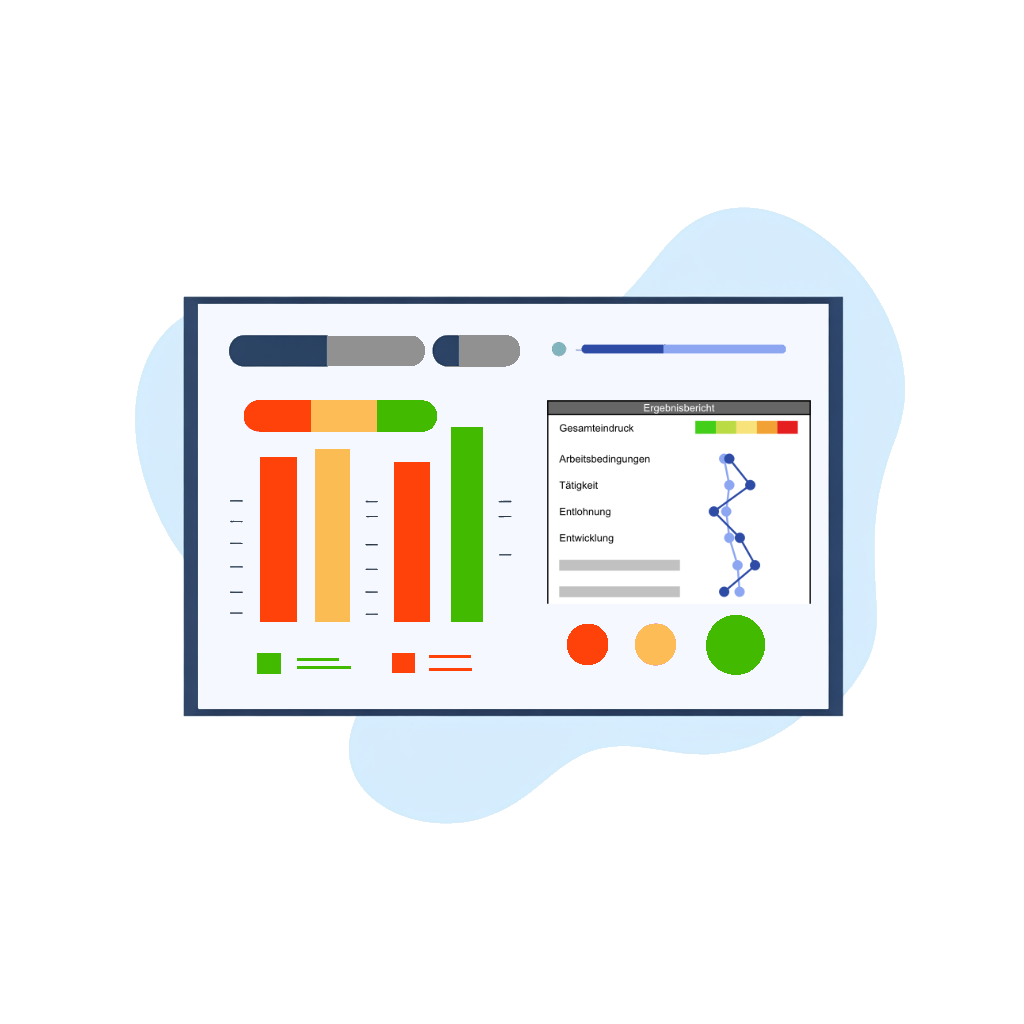
Based on the responses received to the employee survey, we create reports (also called “standard reports”) for individual survey units (e.g. departments) as well as combined organizational areas (e.g. the entire organization). The structure and design of the reports follow the proven Cubia standard.
We suggest a minimum of 5 people as the evaluation limit, i.e. at least 5 people must have participated in order to create a results report (e.g. from a department). Otherwise, no report will be created. Results for questions that have fewer than 5 answers will not be shown. In such a case, the corresponding line in the report would be empty. In this way, no conclusions can be drawn about individual people in the evaluation and reporting.
The standard reports recommended by Cubia serve to provide feedback on the results to the responsible managers. They provide a compact, easy-to-understand but still detailed presentation of the results and serve as a guiding basis for action for all management levels.
The reports may contain the following data in detail and after consultation with the customer:
- Survey data overview with participation rate(s)
- the questions asked
- the number of answers per question
- the distribution of answers on the scale offered (frequency distribution)
- the arithmetic mean (average of the answers given)
- Indices (if desired/provided)
- Comparison with the next highest organizational unit with graphic indication of statistically significant differences (internal benchmark*)
- Comparison with the overall result of the organization (internal benchmark*)
- For follow-up surveys: time comparison**
Values and numbers are presented both numerically and graphically to ensure easy readability and clarity.
* Internal Benchmarks
Cubia standard reports usually include an internal benchmark (“upward comparisons”).
** Comparisons to a Preliminary Survey
The results of the previous survey are included in the standard reports so that changes can be immediately identified. If the previous survey was not carried out by Cubia, the previous results can be imported by Cubia and thus made comparable.
Marking Relevant Aspects in the Reports
By statistically analyzing the responses from the employee survey, Cubia can determine, on a customer-specific basis, those statements with the greatest influence on certain target variables such as satisfaction, loyalty or performance.
By graphically highlighting these issues in reports, managers are drawn to these aspects and the “leverage effect” of these aspects can be taken into account when determining actions.
Are You Interested in Our Results Reports?
Request a non-binding offer now.
Special Reports
Cross-Comparisons
In the mean value comparison report, the results of various freely definable employee groups are presented in a comparative manner. A cross-comparison of the selected employee groups is made with the overall result of the employee survey.
This form of report for evaluating an employee survey is suitable, for example, for presenting differences in socio-demographic data (age structure/length of service, etc.) or for comparing different organizational areas and locations.
Heat Map
In a special, graphical analysis, all results of the entire organization are presented “at a glance”.
A freely adjustable limit value (slider) enables visual color highlighting and thus easy and quick identification of which parts of the organization show particularly positive or negative results in the employee survey.
Management Report
The management report is an expert analysis of the overall results of the employee survey, including recommendations for action and a presentation by one of our scientific partners.
The management report uses various analysis methods to gain comprehensive insights. Calculated correlations, for example, illustrate connections between individual questions, such as the influence of certain observations on the experience of stress and strain.
Variance analyses are used to compare the influence of different work areas on employees’ perceptions.
Regression analyses (driver analyses) identify which perceptions are particularly strongly linked to affective commitment. This allows us to clearly highlight the weighting of individual question complexes and questions in the survey.
In addition, multilevel analyses are used to link survey data with external indicators such as sickness or fluctuation by relating aggregate and individual data.
Further information on the management report is provided in the Follow-up section.
Manual Analysis
Evaluations of Text Responses
We generally only provide free-text answers to employee surveys at the overall organizational level. Exceptions are companies with international or numerous different locations or subsidiaries.
When analyzing and categorizing free text responses with up to approximately 1,000 responses, we recommend manual analysis by experienced Cubia employees.
On request, this can be included as an optional service in a non-binding offer. The majority of our customers carry out their own analyses and evaluations within their organization.
For larger response volumes, manual analysis is not possible or would not be feasible in terms of time and financial expenditure.
AI-Supported Text Analysis
Cubia AG can automatically categorize and summarize the free-text answers of an employee survey using an AI-supported process. However, 100% accuracy is not guaranteed and would not be possible even with experienced manual analysis due to people’s subjective perceptions.
The software used by Cubia to analyze text responses has the following quality features:
- Local (no cloud solution or ChatGPT, data remains protected and confidential)
- AI-supported anonymization (e.g. replacing names with placeholders) before starting the analysis
- Experience shows good results after project-specific model training of the system
- Foreign languages also possible
- Summaries can also output the number of positive, neutral and negative answers for different question types
- On request, summaries of the text answers can be included for aggregated reports (e.g. overall report)

Report Submission
Sensitive documents such as result reports must be sent to the recipients in a data-secure manner after the employee survey has been completed. Sending them via email is less suitable for this, as it is not protected against unauthorized access (e.g. due to deputization rules, email distribution lists, etc.) in the company network without a complex end-to-end encryption process.
The Cubia vault process guarantees a secure and confidential transfer of result reports and other sensitive documents. A corresponding white paper will be provided by Cubia in preparation for the survey.
Advantages
The advantages of this procedure compared to sending (password-protected) documents via email are as follows:
- The recipient decides when he wants to have the documents
- The transfer is documented in an audit-proof manner
- The technical data security is significantly greater than with a “standard email delivery”
- The transfer can be planned “at your leisure” and configured in advance.
Prior to the report handover, the client’s project management provides the recipient addresses authorized to access each result report so that Cubia can release them in advance.
Another option for report distribution is for the human resources department to receive all employee survey results reports and forward them internally independently.


